Profitability Improves over First Quarter
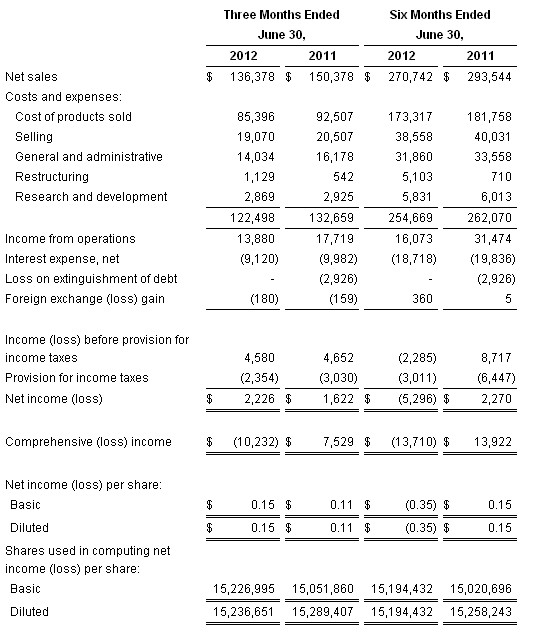
Xerium Technologies, Inc. (NYSE: XRM), a leading global manufacturer of industrial textiles and roll covers used primarily in the paper production process, announced today the results of its operations for the quarter ended June 30, 2012. Net sales increased 1.5% from the quarter ended March 31, 2012, yet decreased 9.3% from the quarter ended June 30, 2011. On a year to date basis, net sales decreased 7.8% from the six months ended June 30, 2011. Net income per diluted share improved to $0.15 for the quarter ended June 30, 2012 from ($0.50) for the quarter ended March 31, 2012 and$0.11 for the quarter ended June 30, 2011. On a year to date basis, net income per diluted share decreased to a loss of ($0.35) for the six months ended June 30, 2012 from income of $0.15 for the six months ended June 30, 2011.
“Xerium’s second quarter 2012 over first quarter 2012 performance improvement is the result of our continuous focus on operational improvements, our customers’ accelerating adoption of our better performing and higher margin new products, and reduced trade working capital in every region,” said Stephen R. Light, Chief Executive Officer and Chairman. “ While our European business remains soft as the paper industry there is impacted by the region’s ongoing economic crisis, we enjoyed good growth in North America and Asia. 'Vision 2015,' Xerium’s three year strategic realignment of our manufacturing footprint, announced on July 2, 2012, is off to a good start. We expect 'Vision 2015' will restore our historical margins by reducing unnecessary fixed costs and aligning our global capacity with customer demand.”
RESTRUCTURING
As previously reported, on July 2, 2012, we announced a voluntary redundancy program at our press felt facility in Buenos Aires, Argentina in connection with the relocation of our Huyck Wangner press felt capacity and initiated consultation proceedings with our works' council at our rolls cover facility in Meyzieu, Franceregarding a proposal to cease operations there. In Argentina, the production of press felts and fiber cement felts will be transferred to our facilities in Brazil and the roll cover production of our facility in France will be assumed by our rolls facilities in Germany and Italy. The actions are expected to commence in the third quarter of 2012 and be completed over the next several months. As the redundancy program has just been initiated, the proceedings with the works’ council have just begun and there has been no formal evaluation of the affected assets, at this time, we are in the process of analyzing our estimate of the restructuring charges and asset impairments, if any, related to these redundancy programs.
CREDIT FACILITY AMENDMENT
To facilitate the above restructuring activities, on June 28, 2012, we entered into an amendment to our senior secured credit facility. Among other revisions to the credit facility, the amendment allows for additional add backs to Adjusted EBITDA annually through 2015 up to the lesser of $15.0 million or the unused portion of our allowed annual capital expenditure limit; increases the maximum leverage ratios between September of 2012 and December of 2013; amends the definition of the leverage ratio to reduce debt by unrestricted surplus cash held by the Company and increases the interest rate on the term loans by 0.75% annually for eighteen months.
SECOND QUARTER FINANCIAL HIGHLIGHTS
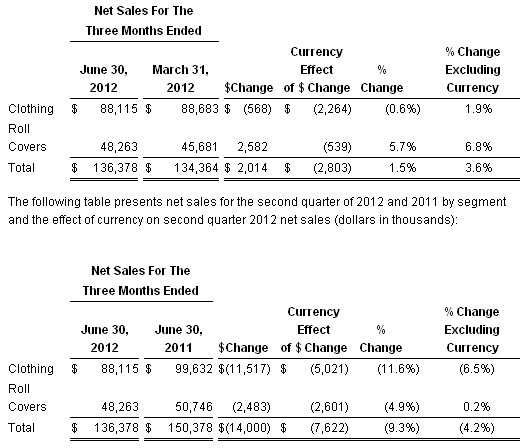
- Net sales for the second quarter of 2012 were $136.4 million, a 1.5% increase compared to the first quarter of 2012. Excluding unfavorable currency effects of$2.8 million, second quarter 2012 net sales increased 3.6% from the first quarter of 2012, with an increase of 1.9% in the clothing segment and an increase of 6.8% in the roll covers segment. Net sales decreased 9.3% from net sales for the second quarter of 2011 of $150.4 million. Excluding unfavorable currency effects of 5.1%, second quarter 2012 net sales decreased 4.2% from the second quarter of 2011, with a decrease of 6.5% in the clothing segment, primarily as a result of the reduced European market demand, and an increase of 0.2% in the roll covers segment. See “Segment Information” and “Non-GAAP Financial Measures” below for further discussion.
- Gross profit increased by 9.8% to $51.0 million for the second quarter of 2012 from $46.4 million for the first quarter of 2012, yet decreased 11.9% from $57.9 million for the second quarter of 2011. In the second quarter of 2012, gross margins increased to 37.4% from 34.6% in the first quarter of 2012. The increase was due to improved product mix, partially as a result of an unusually high level of low margin steel core sales in the first quarter of 2012 and improved labor efficiencies. These increases were offset by currency exchange rate differences and unfavorable factory absorption driven by continued progress in reducing inventory levels. Gross margins declined from 38.5% in the second quarter of 2011 largely as a result of the reduction of inventory reserves in the prior year. Excluding this non-recurring item, gross margins were relatively flat compared to the second quarter of 2011, as unfavorable absorption of production costs and unfavorable regional mix related to the reduced European market demand were partially offset by favorable currency effects and improved material and labor cost efficiencies.
- The Company’s operating expenses (selling, general and administrative, restructuring and research and development expenses) of $37.1 million for the second quarter of 2012 decreased by $3.1 million, or 7.7%, from operating expenses of $40.2 million in the second quarter of 2011. The decrease in operating expenses during the second quarter of 2012 is primarily the result of favorable currency effects of $2.5 million, a decrease of $1.6 million in management incentive compensation and the reversal of a $1.0 million contingent liability that was favorably resolved. Partially offsetting these items was an increase in general and administrative expenses due to the reversal in 2011 of $1.1 million in value added tax in Brazil and $0.6 million related to incremental CEO transition costs in 2012.
- Interest expense improved 9.0% to $9.1 million in the second quarter of 2012 from $10.0 million in the second quarter of 2011. This decline in interest expense reflects lower current interest rates and debt balances and favorable currency effects, net of higher deferred financing cost amortization in the second quarter of 2012. The decrease in interest rates and the increase in deferred financing cost amortization are a result of the refinancing in May 2011. Cash interest expense, or interest expense less amortization of deferred financing costs, decreased by 12.5% in the second quarter of 2012 to $8.4 millioncompared to $9.6 million in the second quarter of 2011.
- Income tax expense declined to $2.4 million in the second quarter of 2012 from $3.0 million in the second quarter of 2011. This reduction was primarily attributable to the geographic mix of earnings in the second quarter of 2012 as compared to the second quarter of 2011. Our overall effective tax rate for the periods presented reflects the fact that we have losses in certain jurisdictions where we receive no tax benefit.
- Net income for the second quarter of 2012 improved to $2.2 million or $0.15 per diluted share, compared to net loss of ($7.5) million or ($0.50) per diluted share for the first quarter of 2012 and net income of $1.6 million or $0.11 per diluted share for the second quarter of 2011.
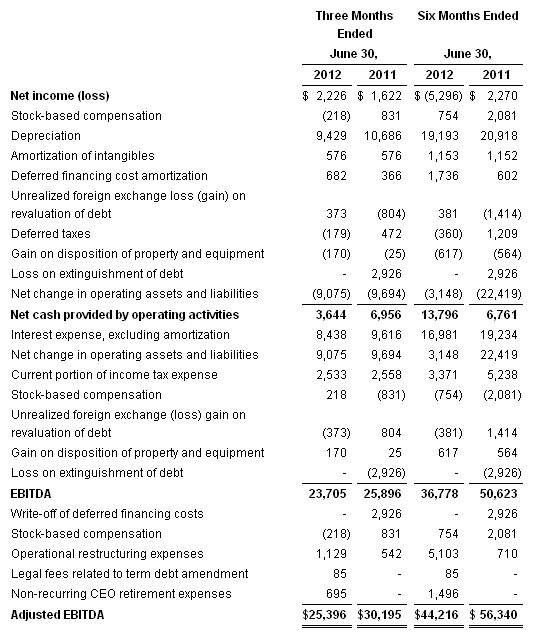
- Adjusted EBITDA (as defined by the Company’s credit facility) of $25.4 million increased $6.6 million in the current quarter from $18.8 million in the first quarter of 2012, yet decreased $4.8 million from $30.2 million in the second quarter of 2011. See “Non-GAAP Financial Measures” below for further discussion.
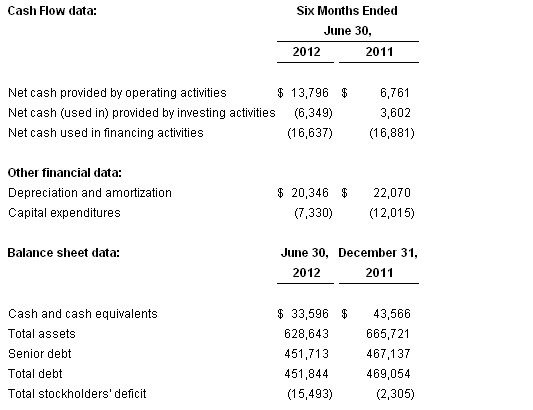
- Cash at June 30, 2012 was $33.6 million, compared to $43.6 million at December 31, 2011. The decrease in the cash balances from December 31, 2011 is primarily due to $14.9 million in payments on long-term debt, capital expenditures of $7.3 million, $1.8 million in payments relating to the credit facility amendment and unfavorable currency effects of $0.8 million. These decreases were partially offset by cash provided by operating activities of $13.8 millionand proceeds from the disposition of property of $1.0 million.
- Total debt at June 30, 2012 was $451.8 million, compared to $469.1 million at December 31, 2011. The decrease of $17.3 million from December 31. 2011 is primarily due to net debt payments of $14.9 million in 2012 and favorable currency effects of $2.4 million.
- Capital expenditures for the six months ended June 30, 2012 were $7.3 million, consisting of $2.1 million in growth capex and $5.2 million in maintenance capex. In the same period in 2011, we reported $12.0 million of capital spending, consisting of $4.6 million in growth capex and $7.4 million of maintenance capex. We are currently targeting total capital expenditure commitments for 2012 at approximately $30 million, while actual cash spent on capital expenditures may be somewhat less due to the timing of the equipment installations.
SEGMENT INFORMATION
The following table presents net sales for the first and second quarter of 2012 by segment and the effect of currency on second quarter 2012 net sales (dollars in thousands):
CONFERENCE CALL
The Company plans to hold a conference call on the following morning:
| Date: | Tuesday, August 7, 2012 | ||||
| Start Time: | 9:00 a.m. Eastern Time | ||||
| Domestic Dial-In: | +1-866-831-6247 | ||||
| International Dial-In: | +1-617-213-8856 | ||||
| Passcode: | 73944707 | ||||
| Webcast & Slide Presentation: |
To participate on the call, please dial in at least 10 minutes prior to the scheduled start. A live audio webcast and replay of the call, in addition to a slide presentation, may be found in the investor relations section of the company’s website at www.xerium.com.
NON-GAAP FINANCIAL MEASURES
This press release includes measures of performance that differ from the Company’s financial results as reported under generally accepted accounting principles (“GAAP”). The Company uses supplementary non-GAAP measures, including EBITDA, Adjusted EBITDA and currency effects on Net Sales to assist in evaluating its liquidity and financial performance. EBITDA and Adjusted EBITDA are specifically used in evaluating the ability to service indebtedness and to fund ongoing capital expenditures. The Company’s credit facility includes covenants based upon Adjusted EBITDA. If Adjusted EBITDA declines below certain levels, the Company could go into default under its credit facility or be required to prepay the credit facility. Neither Adjusted EBITDA nor EBITDA should be considered in isolation or as a substitute for income (loss) or cash flows from operations (as determined in accordance with GAAP).
For additional information regarding non-GAAP financial measures and a reconciliation of such measures to the most comparable financial measures under GAAP, please see “Segment Information” above and our Selected Financial Data below. In addition, the information in this press release should be read in conjunction with the corresponding exhibits, financial statements and footnotes contained in our documents to be filed with the Securities and Exchange Commission.
FORWARD-LOOKING STATEMENTS
This press release contains forward-looking statements involving risks and uncertainties, both known and unknown, that may cause actual results to differ materially from those indicated. These risks and uncertainties include the following items: (1) a sustained downturn in the paper industry, compounded by uncertainty in global economic conditions, particularly those stemming from Europe, could adversely affect our revenues and profitability; (2) our financial results could be adversely affected by fluctuations in interest rates and currency exchange rates, for instance a marked decline in the value of the Euro relative to the U.S. Dollar stemming from the European sovereign debt crisis; (3) market improvement in our industry may occur more slowly than we anticipate, may stall or may not occur at all; (4) variations in demand for our products, including our new products, could negatively affect our revenues and profitability; (5) our manufacturing facilities may be required to quickly increase or decrease production, which could negatively affect our production facilities, customer order lead time, product quality, labor relations or gross profits; (6) our plans to develop and market new products, enhance operational efficiencies, and reduce costs may not be successful; and (7) the other risks and uncertainties discussed elsewhere in this press release, our Form 10-K for the year ended December 31, 2011 filed on March 14, 2012 and our other SEC filings. If any of these risks or uncertainties materialize, or if our underlying assumptions prove to be incorrect, actual results may vary significantly from what we projected. Any forward-looking statement in this press release reflects our current views with respect to future events. We assume no obligation to publicly update or revise these forward-looking statements for any reason, whether as a result of new information, future events, or otherwise. As discussed above, we are subject to substantial risks and uncertainties related to current economic conditions, and we encourage investors to refer to our SEC filings for additional information. Copies of these filings are available from the SEC and in the investor relations section of our website at www.xerium.com.
Selected Financial Data Follows
|
Xerium Technologies, Inc. |
||||||||||||||||
|
Condensed Consolidated Statements of Operations and Comprehensive (Loss) Income |
||||||||||||||||
|
(dollars in thousands, except per share data) |
| Condensed Consolidated Selected Financial Data | |||||||
| (in thousands) |
EBITDA and Adjusted EBITDA Non-GAAP Measures
Non-GAAP Financial Measures
We use EBITDA and Adjusted EBITDA (as defined in our credit facility) as supplementary non-GAAP liquidity measures to assist us in evaluating our liquidity and financial performance, specifically our ability to service indebtedness and to fund ongoing capital expenditures. The credit facility includes covenants based on Adjusted EBITDA. If our Adjusted EBITDA declines below certain levels, we may violate the covenants resulting in a default condition under the credit facility or be required to prepay the credit facility. Neither EBITDA nor Adjusted EBITDA should be considered in isolation or as a substitute for income (loss) or cash flows from operations (as determined in accordance with GAAP).
EBITDA is defined as net income (loss) before interest expense, income tax provision (benefit) and depreciation (including non-cash impairment charges) and amortization.
“Adjusted EBITDA”, under our credit facility means, with respect to any period, the total of (A) the consolidated net income for such period, plus (B) without duplication, to the extent that any of the following were deducted in computing such consolidated net income for such period: (i) provision for taxes based on income or profits, including, without limitation, federal, state, provincial, franchise and similar taxes, including any penalties and interest relating to any tax examinations, (ii) consolidated interest expense, (iii) consolidated depreciation and amortization expense, (iv) reserves for inventory in connection with plant closures, (v) consolidated operational restructuring costs, (vi) noncash charges or gains resulting from the application of purchase accounting, including push-down accounting, (vii) non-cash expenses resulting from the granting of common stock, stock options, restricted stock or restricted stock unit awards under equity compensation programs solely with respect to common stock, and cash expenses for compensation mandatorily applied to purchase common stock, (viii) non-cash items relating to a change in or adoption of accounting policies, (ix) non-cash expenses relating to pension or benefit arrangements, (x) expenses incurred as a result of the repurchase, redemption or retention of common stock earned under equity compensation programs solely in order to make withholding tax payments, (xi) amortization or write-offs of deferred financing costs, (xii) any non-cash losses resulting from mark to market hedging obligations (to the extent the cash impact resulting from such loss has not been realized in such period) and (xiii) other non-cash losses or charges (excluding, however, any non-cash loss or charge which represents an accrual of, or a reserve for, a cash disbursement in a future period), minus (C) without duplication, to the extent any of the following were included in computing consolidated net income for such period, (i) non-cash gains with respect to the items described in clauses (vi), (vii), (ix), (xi), (xii) and (xiii) (other than, in the case of clause (xiii), any such gain to the extent that it represents a reversal of an accrual of, or reserve for, a cash disbursement in a future period) of clause (B) above and (ii) provisions for tax benefits based on income or profits. Notwithstanding the foregoing, Adjusted EBITDA, as defined in the credit facility and calculated below, may not be comparable to similarly titled measurements used by other companies.
Consolidated net income is defined as net income (loss) determined on a consolidated basis in accordance with GAAP; provided, however, that the following, without duplication, shall be excluded in determining consolidated net income: (i) any net after-tax extraordinary or non-recurring gains, losses or expenses (less all fees and expenses relating thereto), (ii) the cumulative effect of changes in accounting principles, (iii) any fees and expenses incurred during such period in connection with the issuance or repayment of indebtedness, any refinancing transaction or amendment or modification of any debt instrument, in each case, as permitted under the credit facility and (iv) any gains resulting from the returned surplus assets of any pension plan.
The following table provides reconciliation from net income (loss) and operating cash flows, which are the most directly comparable GAAP financial measures, to EBITDA and Adjusted EBITDA. Please also see our exhibits to be filed with our current report on Form 8K, which should be read in conjunction with this release.
Source: Xerium Technologies, Inc.